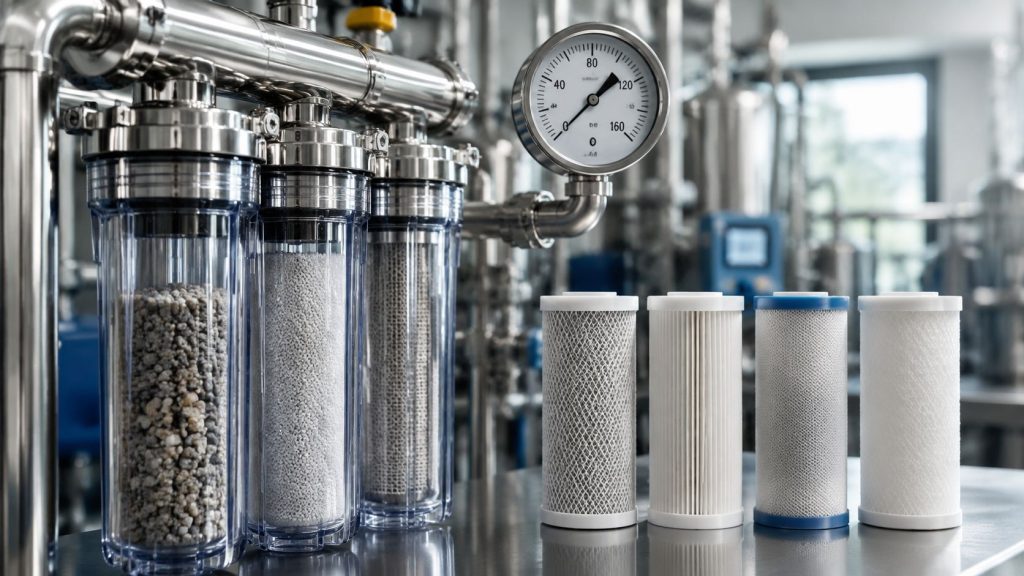
You're usually not asking how often to replace a water filter because you're curious. You're asking because something in the plant is already drifting. Differential pressure is climbing. Flow is softening. Conductivity is creeping up. Or procurement wants a purchase plan for cartridges, carbon, RO elements, and UV consumables without carrying too much stock.
In industrial water treatment, replacement timing isn't a housekeeping task. It's a production decision. Replace too early and you burn operating budget on cartridges that still had usable capacity. Replace too late and you push solids, chlorine, or organics downstream into equipment that's far more expensive to clean, replace, or idle.
That's why the useful answer isn't a single date on a calendar. Industrial systems need a baseline schedule, but effective discipline is performance-based replacement tied to ΔP, flow, and permeate quality.
Table of Contents
- Beyond the Calendar The True Cost of Filter Replacement Timing
- Baseline Replacement Schedules for Industrial Filter Types
- Reading the Signs Key Operational Indicators to Monitor
- Factors That Accelerate Filter Replacement Frequency
- Building a Proactive Maintenance and Inventory Plan
- Shifting From Reactive Replacement to Proactive Optimization
Beyond the Calendar The True Cost of Filter Replacement Timing
A common failure pattern in industrial RO skids looks like a membrane problem. Product quality drops, normalized output falls, and operators start talking about membrane age. In many cases, the membrane wasn't the first failure point. The upstream filter train was.
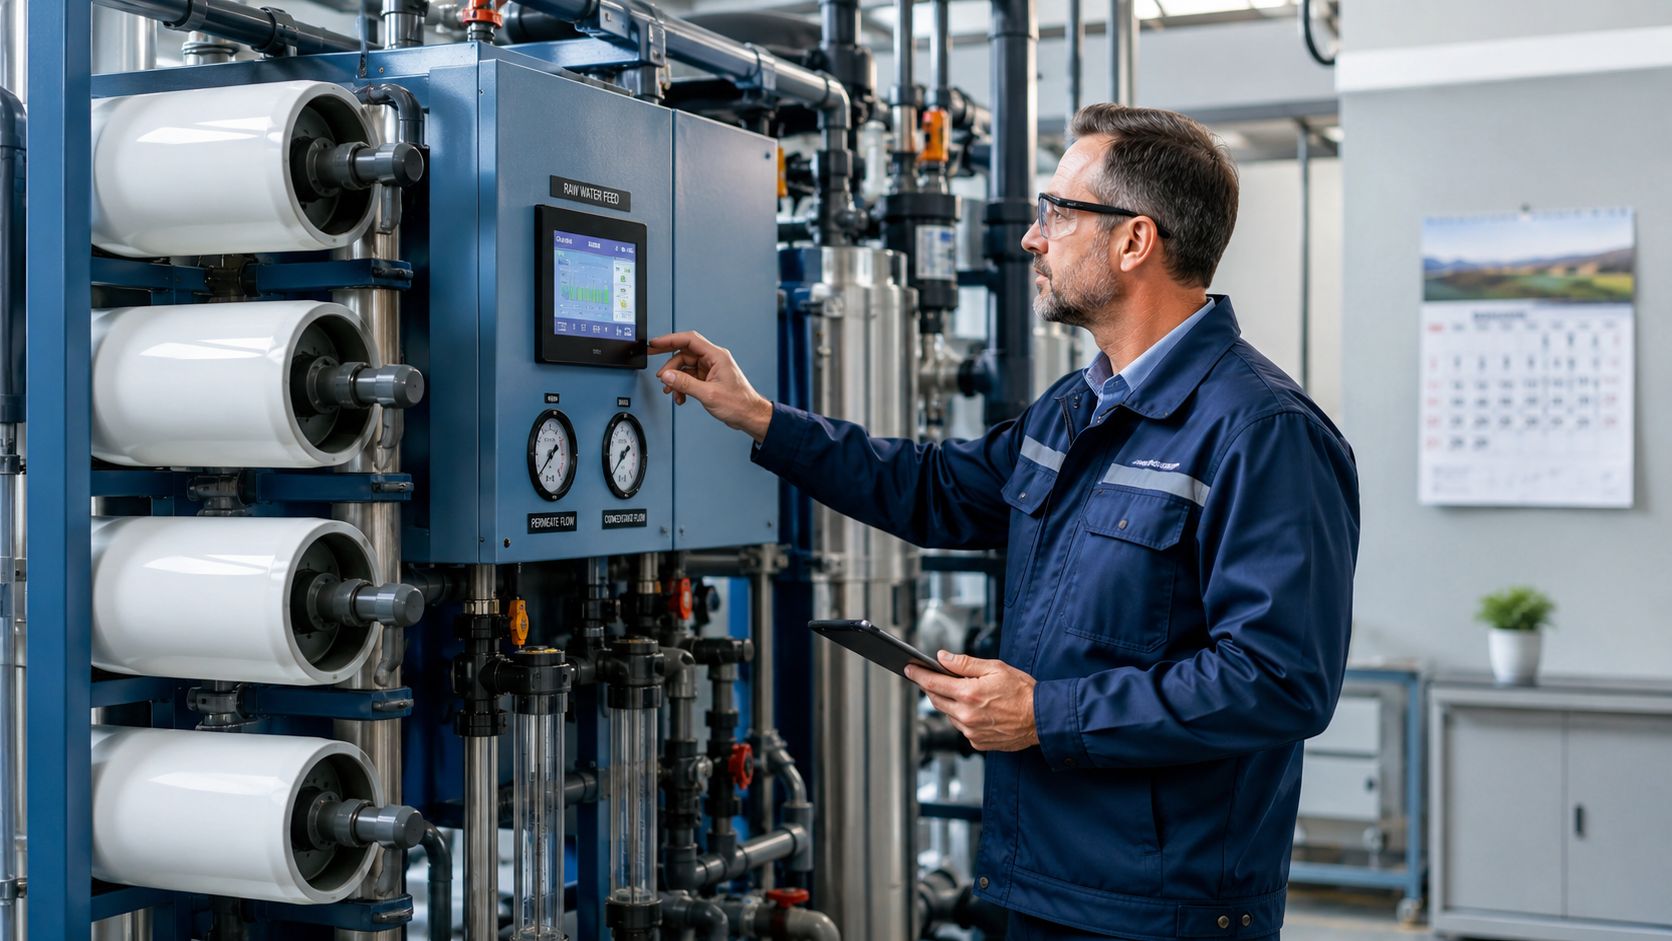
Industrial maintenance teams still get pushed toward residential-style advice. Replace sediment every few months. Replace carbon twice a year. Replace membranes every few years. That's a usable starting point, but it's not how serious process systems should be run when uptime matters.
For industrial systems, the most accurate and economically viable replacement strategy is performance-based monitoring of differential pressure (ΔP), not dates, because industrial pre-treatment filters can degrade in 1 to 3 months with poor feed water quality instead of the 3 to 6 months often seen in lighter-duty settings, as noted by Sai Filter's discussion of cartridge change intervals.
Calendar logic breaks down in industrial service
A fixed date works only when feedwater quality, loading, operating hours, and production demand stay stable. In most plants, they don't. A food plant pulling from one source during normal operation and another during seasonal constraints won't load filters the same way. A mining or oil and gas site with variable suspended solids certainly won't.
That mismatch creates two bad outcomes:
- Premature changeout: operators swap cartridges because the date arrived, not because the media is spent.
- Late changeout: operators stretch intervals because the last set lasted longer, then a short-term feed upset blindsides the system.
Practical rule: Use the calendar to trigger inspection, not to make the final replacement decision.
The real cost sits downstream
Pre-treatment is cheap compared with the assets it protects. A cartridge bank, carbon vessel, or multimedia stage is there to shield RO elements, EDI modules, valves, and instrumentation from solids, oxidants, and fouling precursors. When upstream protection slips, the repair bill moves fast.
That's why teams evaluating RO membrane replacement cost should look upstream first. If you only budget for membrane age and ignore cartridge loading, chlorine control, and pressure trend data, you're treating symptoms instead of the cause.
The plants that control operating cost best usually do one thing differently. They stop asking for a universal date and start asking what the skid is telling them today.
Baseline Replacement Schedules for Industrial Filter Types
A plant running three shifts cannot wait for a filter to fail before deciding what to stock. Buyers need reorder points. Maintenance needs outage planning. Operations needs enough margin to protect RO, EDI, UV, and final-use equipment when feed conditions change faster than the calendar.
That is why baseline intervals still matter. They are planning numbers, not replacement decisions.
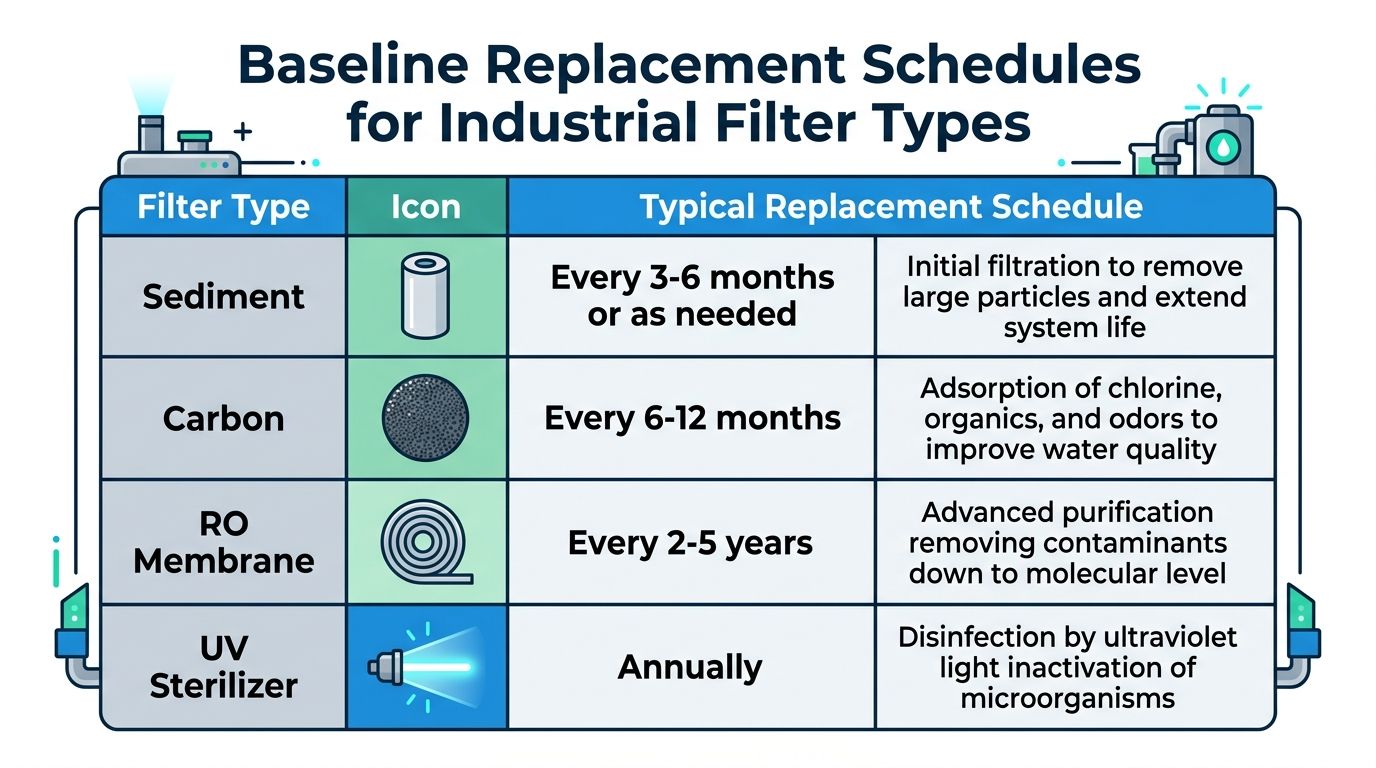
Use them to set purchasing cadence, minimum stock, and preventive inspection dates. Then confirm actual changeout timing with operating signals such as differential pressure, chlorine breakthrough, normalized flow, and treated water quality. That approach cuts two expensive mistakes. One is throwing away usable media. The other is running a cheap filter long enough to damage expensive downstream assets.
Sediment and depth pre-filters
Sediment cartridges and depth media usually have the shortest service life in an industrial skid because they take the first hit from suspended solids, rust, scale fragments, and upset conditions after tank work or line maintenance. In many plants, a practical starting window is a few months, then shorter or longer based on solids loading and pressure-drop trend.
For planning, this framework is usually enough:
| Component | Baseline replacement window | Why it matters |
|---|---|---|
| Sediment pre-filter | Short-cycle consumable. Often planned in monthly to quarterly intervals depending on feed quality | Limits solids carryover to pumps, valves, and membranes |
| Depth filtration stage | Similar planning band, adjusted for media rating and upstream variability | Stabilizes turbidity and reduces fouling load on downstream treatment |
| Annual backstop review | Review any filter left in service for extended periods at least yearly | Prevents forgotten cartridges and hidden performance drift |
The trade-off is straightforward. Changing sediment cartridges too early increases consumable cost and labor. Changing them too late raises ΔP, reduces available flow, and pushes fines downstream where the cleanup cost is much higher.
Activated carbon cartridges and vessels
Carbon needs a different replacement mindset. A sediment filter usually advertises the end of its life with pressure loss. Carbon can keep passing water while losing the capacity to remove free chlorine, chloramine, or organics. That is a membrane protection problem, not a housekeeping problem.
In industrial RO pretreatment, carbon is commonly planned on a several-month to annual service window, then verified with residual oxidant testing and, where relevant, TOC or odor-related performance checks. Carbon vessel media may last longer than small cartridges because of bed depth and contact time, but both should be treated as exhaustion-driven media. Appearance is not a reliable indicator of remaining capacity.
NSF explains the role and limits of activated carbon in water treatment, including contaminant reduction claims that depend on operating conditions and media condition, in its guidance on activated carbon filters for drinking water treatment. In practice, the right question is not how old the carbon is. The right question is whether it is still protecting the membrane train.
RO membranes
RO membranes are capital consumables, so replacement planning belongs in the budget. Actual replacement belongs in performance review. Well-protected elements can stay in service for years. Poor pretreatment, oxidant exposure, scaling, or repeated fouling events can shorten life sharply.
Membrane manufacturers generally frame service life as application-dependent rather than calendar-fixed. DuPont Water Solutions notes that reverse osmosis element life depends on feedwater quality, pretreatment, operating conditions, and cleaning practice in its technical guidance for FilmTec reverse osmosis elements. That matches what plants see in the field. Two systems installed on the same date can end up with very different membrane life because one skid held stable pretreatment and the other ran through repeated solids and chlorine excursions.
For budgeting, treat membranes as multi-year assets. For replacement timing, use normalized permeate flow, salt rejection, cleaning recovery, and pressure profile.
UV lamps and post-filters
UV systems and post-filters are easy to under-manage because they do not always create a clear pressure-drop signal. The lamp may still be on while UV output has fallen below the dose required for the target organisms. A post-polishing carbon or final cartridge may still pass flow while microbiological risk or taste and odor control has worsened.
Trojan Technologies notes in its UV water treatment lamp replacement guidance that UV lamps are consumable components with expected replacement intervals tied to lamp life and validated system performance. In plant terms, annual lamp budgeting is common, but the operating hour count and the controller's UV intensity or alarm history should drive the work order. Final polishing filters are usually stocked on a routine replacement cycle and checked against product-water requirements, sanitation practice, and any downstream customer specification.
A baseline schedule gives the plant a usable starting point for inventory and budgeting. The lower-cost, lower-risk decision comes from pairing that baseline with actual operating performance.
Reading the Signs Key Operational Indicators to Monitor
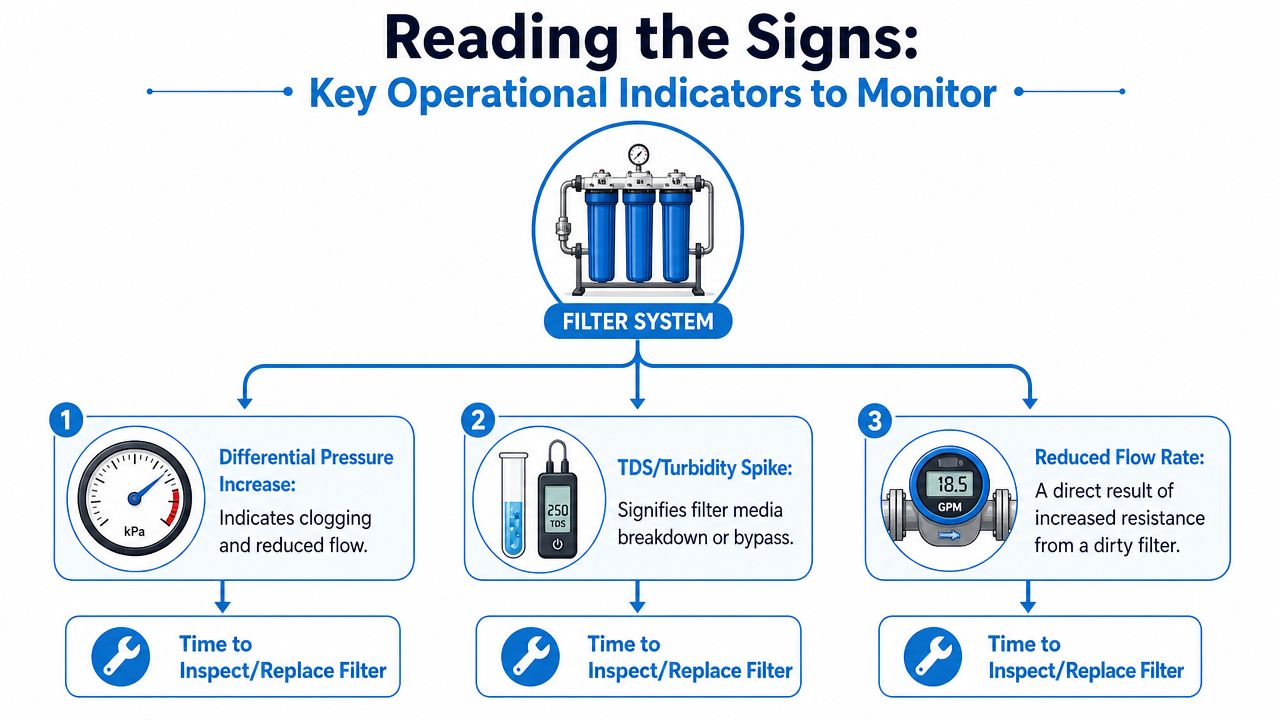
A plant that wants better answers on how often to replace a water filter needs to watch operating signals, not just elapsed time. Three indicators carry most of the decision weight in industrial pre-treatment and RO systems: differential pressure, flow, and permeate quality.
Differential pressure across pre-treatment
ΔP is the clearest day-to-day indicator for cartridge loading. If the pressure drop across a sediment stage keeps climbing, solids are accumulating and the filter is losing available capacity.
In industrial RO systems, sediment filters are typically replaced when differential pressure exceeds 10 Psi or when flow declines visibly, according to Mojawoda's practical industrial filter schedule. That trigger matters because it helps prevent clogging and fouling from being pushed downstream into RO membranes.
The useful practice is straightforward:
- Record clean-start ΔP: log the pressure drop immediately after installing a new cartridge set.
- Trend by operating condition: compare readings at similar production rates, not random snapshots.
- Set an action point: once the system approaches the site's accepted terminal ΔP, inspect and replace.
Flow decline and what it usually means
Flow is often the first thing operators notice because it affects production directly. If feed flow or downstream delivery starts falling while upstream demand is unchanged, restriction is building somewhere.
That doesn't always mean the filter alone is at fault. A fouled housing, stuck valve, unstable feed pump, or control issue can distort the picture. But in cartridge pre-treatment, visible flow decline paired with rising ΔP usually points to a loaded element bank.
A good operating check uses both readings together:
| Signal | What it usually indicates | Typical response |
|---|---|---|
| Rising ΔP, stable quality | Solids loading in pre-filter | Inspect and plan changeout |
| Rising ΔP, falling flow | Filter near terminal condition | Replace soon |
| Stable ΔP, lower flow | Look beyond the cartridge stage | Check pump, valves, and fouling elsewhere |
Don't treat flow decline as a customer complaint issue alone. In industrial service, it's often an early warning for asset protection.
Permeate conductivity and membrane condition
Once you move to RO, replacement decisions get more nuanced. Membranes can foul, scale, oxidize, or age out. You need to read the membrane through its output.
Industrial RO membrane condition is commonly monitored through normalized permeate flow, total pressure drop, and salt passage, with conductivity rise indicating loss of rejection. The same source notes membranes have a design lifespan of 3 to 5 years under normal usage with proper pre-treatment, but that can degrade to 12 to 18 months if chlorine exceeds 0.1 ppm or feedwater hardness surpasses 15 μS/cm, as described in this industrial RO maintenance guide from Waterlinks.
For day-to-day operations, the practical interpretation is:
- Normalized permeate flow drops: fouling or scaling is reducing production.
- Pressure drop rises across the array: feed channels may be fouled.
- Permeate conductivity rises: rejection is weakening, often from membrane damage or severe fouling.
If cleaning restores performance, replacement may wait. If cleaning no longer restores expected output or rejection, you're nearing end of useful life.
Factors That Accelerate Filter Replacement Frequency
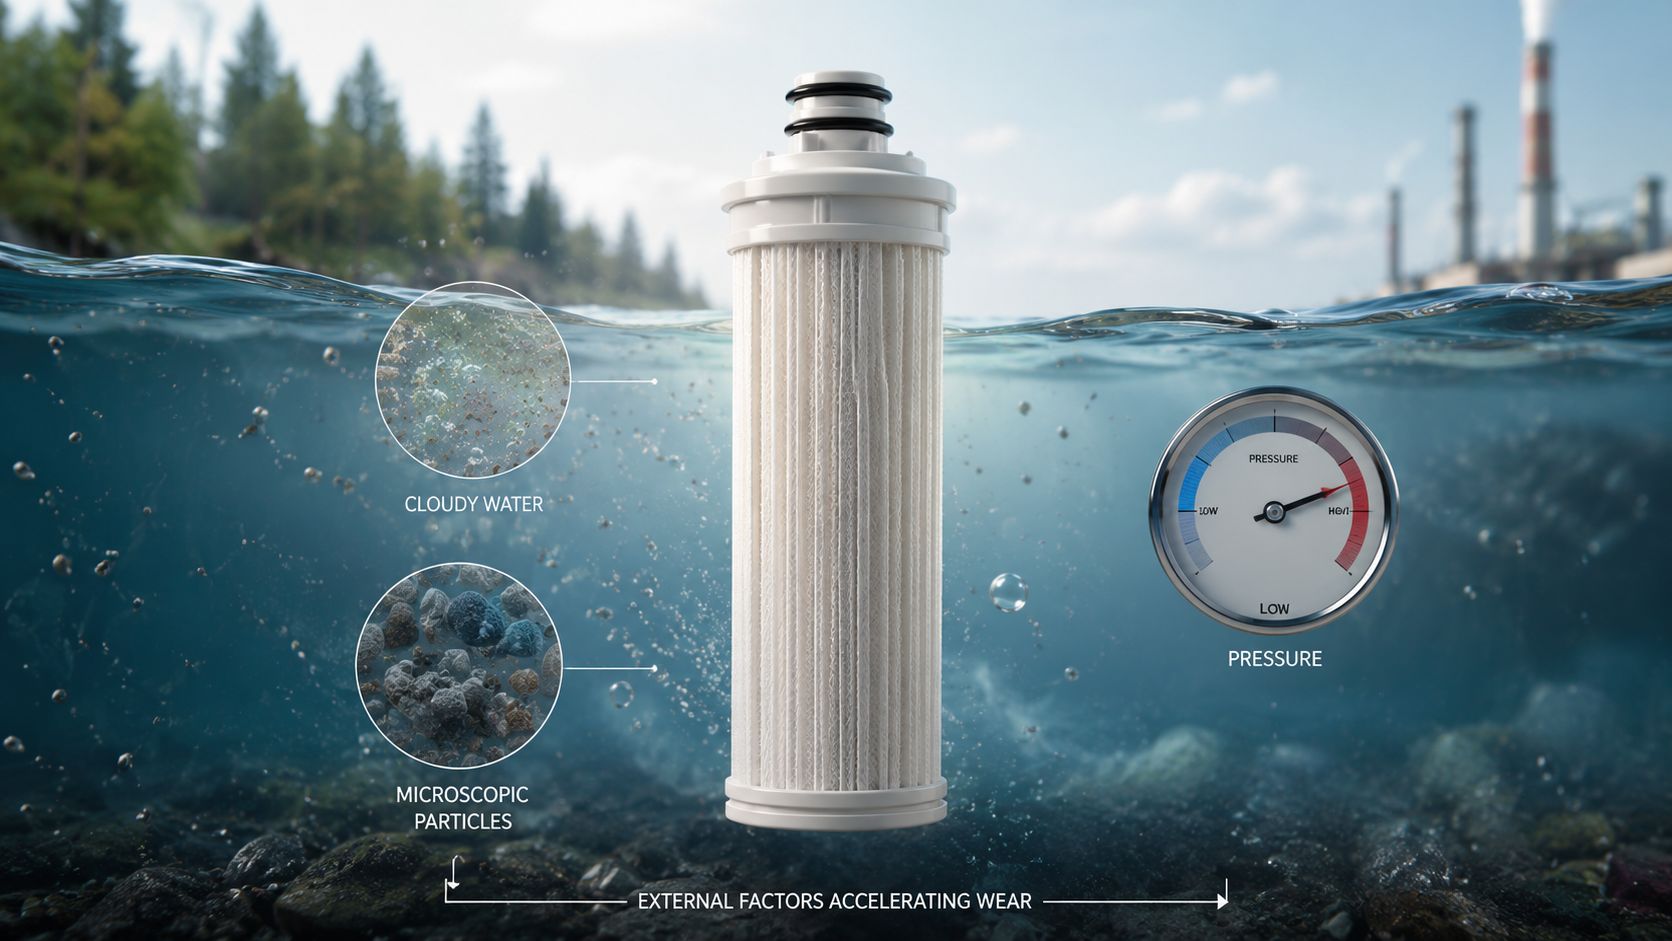
Two plants can run the same housings, the same micron rating, and the same membrane model and still consume filters at completely different rates. The difference is usually feedwater.
Feedwater quality changes everything
Most published membrane intervals are too static for industrial reality. The actual multiplier is contaminant loading, especially when source quality moves around during the year or changes with process reuse.
Most guides cite a 2 to 5 year lifespan for RO membranes, but variable feed water can push replacement down to 12 to 24 months when high TDS, silica, or organic loads are present, which is especially important in reuse applications where feed quality is less predictable, according to Springsv's discussion of replacement frequency under variable water quality.
If you're unsure how aggressive the incoming water really is, a basic hard water test is often a useful first screen before you decide whether your current pre-treatment is enough for the membrane train you're trying to protect.
Water reuse and unstable loading
Reuse systems raise the stakes because the feed often carries more variability than a stable municipal source. One week the solids profile looks manageable. The next week organics, hardness, or dissolved load shifts enough to shorten the useful life of both pre-treatment and RO.
Operators often find themselves trapped by “normal” intervals. The schedule was built around average water. The plant is now feeding the skid with upset water.
A few field realities matter more than vendor brochure timing:
- Source blending: different wells, municipal tie-ins, or reclaim streams don't foul filters equally.
- Seasonal solids: surface-influenced supplies can load cartridges much harder during certain periods.
- Chemical mismatch: pre-treatment chemistry that worked on one feed may underperform when the feed changes.
The filter doesn't care what the PM schedule says. It responds to what's in the water.
Why one plant burns through filters faster than another
The shortest replacement cycles usually show up where three conditions overlap: inconsistent feed quality, high solids, and weak operational tracking. If operators don't trend pressure, they discover the problem only after flow or quality has already shifted.
That's also why generic advice often disappoints procurement teams. A buyer sees a six-month carbon expectation or a multi-year membrane expectation, then watches actual usage come in far shorter. The issue isn't necessarily the component. It's often the application.
Industrial buyers should press suppliers on compatibility, loading assumptions, and operating envelope. Ask what the recommendation assumes about turbidity, chlorine control, hardness, and pretreatment stability. Without that context, a replacement interval is only a rough guess.
Building a Proactive Maintenance and Inventory Plan
At 2 a.m., nobody cares what the PM calendar said. They care that the RO train is losing throughput, the pretreatment skid is in alarm, and the replacement cartridges are not in stores. A proactive plan prevents that failure chain by tying maintenance decisions to operating limits and by stocking the parts that protect production.
Pre-filter neglect shortens downstream equipment life. In practice, the first hit is usually higher solids loading, oxidant breakthrough, or unstable feed to the RO. The next hit is more frequent cleaning, faster membrane fouling, and earlier element replacement. That is why maintenance planning should be built around trigger points such as rising differential pressure, reduced normalized flow, and water quality drift, not just a standing date on the calendar.
Set review intervals, then replace on condition
Plants still need structure. Operators need a defined check cadence, and buyers need forecastable demand. The mistake is using the review date as the automatic changeout date.
A better plan is simple. Set fixed inspection and review intervals, then use actual skid performance to decide whether the filter stays in service or comes out.
A practical program usually includes:
- Shift or daily logging: record ΔP across each critical stage, flow, and the quality parameters that show protective performance for the next unit operation
- Weekly visual checks: inspect for bypass, damaged housings, seal wear, corrosion, and signs of channeling or media settling
- Monthly or planned outage reviews: compare current readings to clean-start baselines and decide which filters should be changed before the next operating window
- Post-upset verification: inspect pretreatment after feedwater excursions, CIP events, chemical feed problems, or seasonal solids spikes
That approach gives operations room to use cartridge life where conditions are stable, while still protecting membranes and polishing units when the feed shifts.
Build inventory around downtime risk
Inventory planning starts with one question. If this part is unavailable today, what stops tomorrow?
Cheap parts often carry the highest production risk. A cartridge, gasket, or clamp can idle a full train if the plant cannot close the housing and restart safely. By contrast, a higher-cost item with long service life may not need shelf stock if lead time is manageable and there is installed redundancy.
The housing matters too. Plants that standardize on common seal sizes, clamp styles, and cartridge filter housing components usually reduce maintenance delays during routine changeouts and emergency repairs.
Grouping stock by operational impact keeps the storeroom rational:
| Stock class | Examples | Planning logic |
|---|---|---|
| High-use protective consumables | Sediment cartridges, carbon cartridges, common seals | Keep local stock because these parts directly protect downstream equipment and are replaced often |
| Long-lead critical components | RO elements, UV lamps, specialty polishing filters | Stock based on supplier lead time, installed redundancy, and consequence of failure |
| Maintenance hardware | O-rings, clamps, pressure gauge isolators, housing internals | Carry enough to complete changeouts without extending downtime for minor mechanical issues |
Tie purchasing decisions to asset protection
Procurement and maintenance should evaluate filter replacement the same way operations does. What decision protects the train at the lowest real operating cost?
That means comparing the price of a changeout against the cost of deferred action:
- Consumables spend versus membrane fouling, extra CIP frequency, and shorter asset life
- Planned outage timing versus the cost of an unplanned stoppage
- Supplier lead time versus the carrying cost of additional stock
- Part standardization versus the performance benefit of a more specific media or micron rating
I advise plants to review these decisions at the system level, not by line-item price alone. Front-end filters are low-cost components with high influence on uptime. If they are managed by condition and stocked by criticality, the plant spends less on emergency freight, avoids preventable membrane damage, and keeps water production predictable.
Shifting From Reactive Replacement to Proactive Optimization
The best industrial answer to how often to replace a water filter is never just a date. It's a controlled decision built from baseline intervals, live operating data, and a realistic view of feedwater variability.
Plants that rely only on calendar replacement usually drift into one of two problems. They either change filters too early and waste operating budget, or they wait too long and let fouling, oxidant exposure, or solids loading damage more valuable equipment downstream.
A stronger approach is more disciplined, but it isn't complicated. Set baseline intervals for sediment, carbon, RO membranes, UV lamps, and polishing stages. Establish clean-start operating values. Trend ΔP, flow, and permeate quality. Adjust replacement timing when the feed changes, not after the skid has already lost performance.
That shift changes the role of filter replacement. It stops being a routine purchasing task and becomes part of system optimization. That's where lower total cost of ownership comes from. Not from squeezing every cartridge to the last possible day, and not from swapping parts on autopilot.
It comes from protecting the train as a whole. Cartridge filters protect carbon and RO. Carbon protects membranes from oxidants. Stable RO performance protects downstream polishing and final water quality. When that chain is managed as one system, uptime improves and maintenance becomes more predictable.
If your plant is still treating filter replacement as a calendar event, the next improvement isn't another reminder in the CMMS. It's better operating criteria, better stocking discipline, and better component selection for the water you have.
If you need help sourcing industrial-grade cartridges, RO membranes, EDI components, or pre-treatment equipment for a more disciplined replacement program, contact Purecowater. Their team supports industrial filtration, RO, and high-purity water applications with OEM sourcing, application guidance, and practical help building a maintenance plan around uptime and total cost of ownership.